Research Benchmarks
2006 Update
(Archive | Logan | COM Department)
This page contains updates to the 2001 Research Benchmarks paper, plus some additions. Data sources are appended as excel spread sheets or charts; sources of information are indicated on the page, on "larger image" pages, or on the excel charts. If you have inquiries, please reach me at (mayfly@uri.edu).
Links to the original data are provided so that you may check for yourself. In general, the NSF data is downloaded from a federal database and should be accurate. Personal income and higher education authorization data are also sited, and downloaded from the original sources. CPI, used to adjust for inflation was downloaded from the Bureau of Labor Statistics; it is listed in the first excel table. The state budget data was copied by hand from many volumes and may contain transcription errors, but it seems to follow the original benchmark study. Still, user beware!
1) RI's budget grows; RI's budget for URI shrinks. |
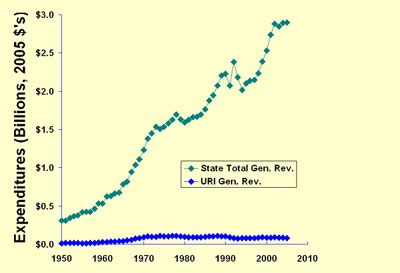
Source: Rhode Island State Budget (URI Library) |
Source: Rhode Island State Budget (URI Library) |
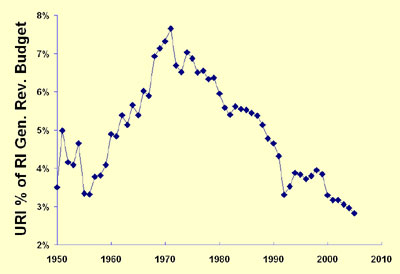
2) URI gets a declining percentage of RI's budget. |
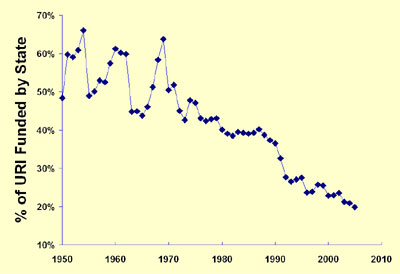
3) RI funds a declining percentage of URI's budget. |
Source: Rhode Island State Budget (URI Library) |
Source: National Science Foundation—WebCaspar (webcaspar.nsf.gov) |
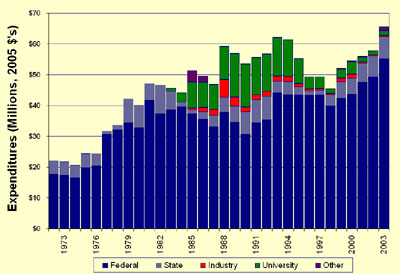
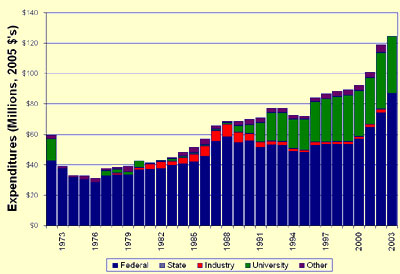
4) URI budgets less for research. Since 1990, institutional funds are a less significant part of URI's research expenditures. |
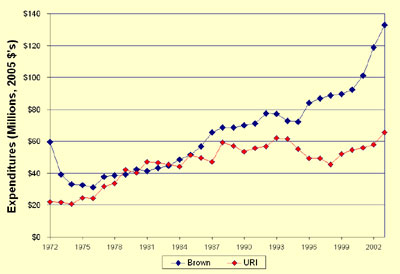
5) Brown is growing its research program. Brown, RI's other research university, and URI had nearly equal research expenditures in the mid 1980s. Brown's growth was accomplished with a generous infusion of institutional research funds. |
Source: National Science Foundation—WebCaspar (webcaspar.nsf.gov) |
Source: National Science Foundation—WebCaspar (webcaspar.nsf.gov) |
6) University research in RI is going private. Does Brown's growing research presence and URI's lack of growth suggest a state policy of privatizing academic research? |
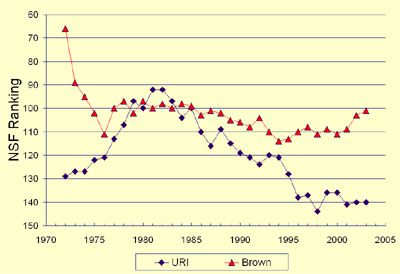
7) Should URI be a "top 100" research university? The "top 100" research universities are ranked on NSF's science and engineering expenditure data. URI and Brown were both "top 100's" in the early 1980s; In 1985, Brown ranked 99 and URI 100. In 2003, Brown ranked 101 and URI 140. To return to the "top 100" URI must double its research expenditures (See ProJo from June 10, 2006) |
Source: National Science Foundation—WebCaspar (webcaspar.nsf.gov) |
"Rhode Island ranks dead last in the nation in research and development dollars expended by our public schools of higher education. We need to change that." RI State of the State Address, 2/04/2003
Source: National Science Foundation—WebCaspar (webcaspar.nsf.gov) |
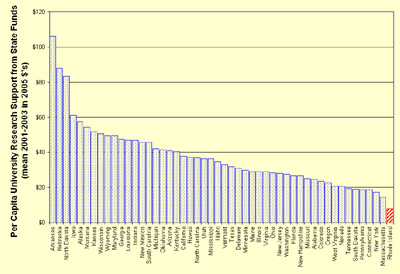
8) RI is 50th in State Support for University Research The mean $'s per capita of state funds (state agency funds to both public and private institutions for contracted research plus state university (i.e. "public") institutional funds) for the three fiscal years 2001-2003 was $7.82 in Rhode Island, 21% of the national average of $37.38, placing Rhode Island last in the nation. |
"Contrary to elementary and secondary—where our spending is among the highest in the nation—in higher education...our investment is among the lowest (44th)."
"I believe there is a direct connection between economic development and the vibrance of higher education. Private institutions have been investing and prospering, while the state has been under-investing. Although we will continute to support RIC and CCRI, URI is uniquely positioned in the biosciences, pharmacology, engineering, and marine sciences. It's time to invest in these sciences for the jobs of the 21st century." RI State of the State Address, 2/04/2004
9) Rhode Island is 44th in supporting Higher Education Operations. Rhode Island's per capita 2005 state allocation for higher education operations was $165, 79% of the national average. |
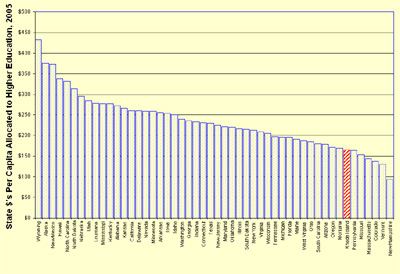
Source: Illinois State University College of Education Center for Higher Education and Educational Finance (Grapevine) (http://www.coe.ilstu.edu/grapevine) |
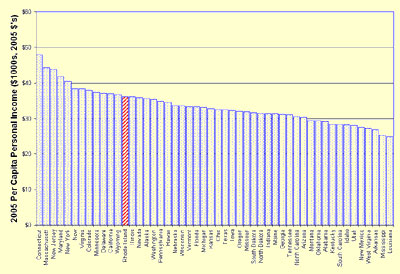
Source: U.S. Department of Commerce, Bureau of Economic Analysis (http://www.bea.gov/bea/newsrelarchive/2006/spi0306.xls) |
10) RI Personal Income is high. Rhode Island mean personal income in $2005 was $36,153 (105% of U.S. average), ranking RI 13th (up from 18th in 1999). In part, this is related to high incomes in Connecticut ($47,819 — #1) and Massachusetts ($44,289 — #2); approximately 1 in 7 residents of Rhode Island work in these two states. |
11) RI's Research % of Higher Ed is Low. Research expenditures (figure 8), taken as a mean of 2001-2003 in 2005 dollars, is not strictly comparable to higher education operations allocations (figure 9), using 2005 figures, but their ratio does provide a reasonable approximation of the relative importance of research within the higher education budget of each state. RI's ratio of Research operations as a percentage of higher education operations, approximately 4.7%, is 28.9% of the national average, or less than one-third of the proportion spent on research in the average state. |
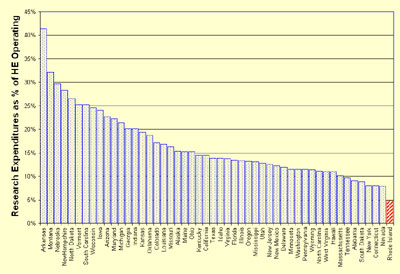
Source: See figures 8 and 9 |
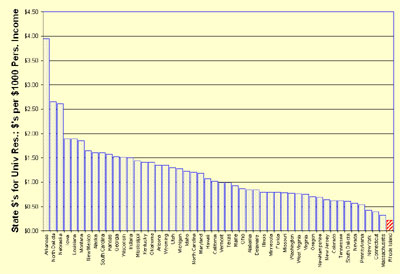
Source: See figures 8 and 10. |
12) We Spend Little Personal Income on Research. Although relatively well off individually, collectively we spend little of our 13th place per capital personal income on university research. Our ratio of $.22 spent on university research per $1000 of personal income is 18.5% of the national average ($1.17), again earning RI a 50th place ranking. |