Approximation of Research as a Percentage of Higher Education Operating Allocation, 2005
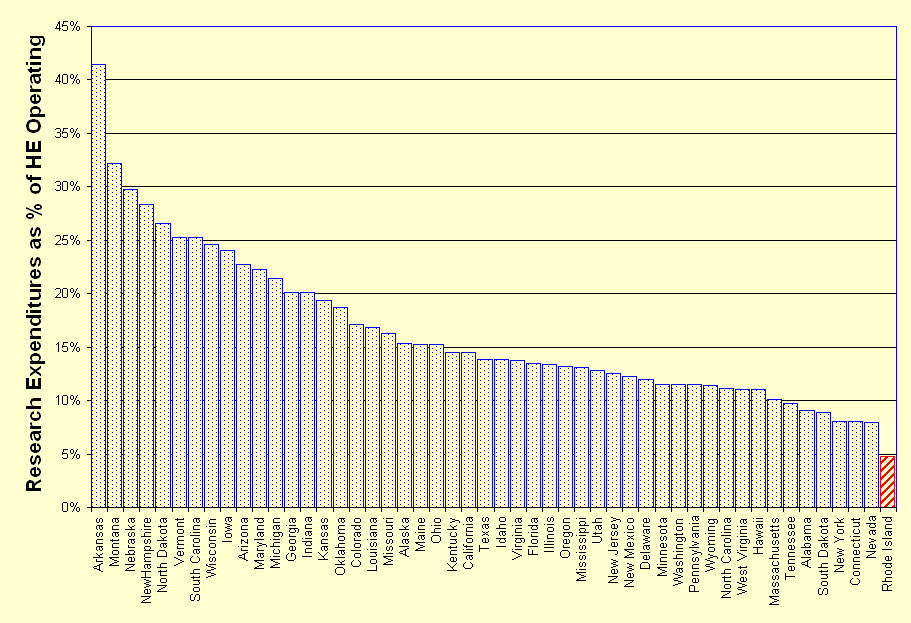
Research expenditures (figure 8), taken as a mean of 2001-2003 in 2005 dollars, is not strictly comparable to higher education operations allocations (figure 9), using 2005 figures, but their ratio does provide a reasonable approximation of the relative importance of research within the higher education budget of each state, and this is what this graph is intended to suggest. (The correct ratio requires expenditure data from comparable years, instead of the authorization figure used here, but the point would remain the same as far as Rhode Island's relative priorities of research within the larger higher education system.)
Source: See figures 8 and 9
(Excel Spreadsheet and chart)