Per Capita Research $'s from State Funds, Mean 2001—2003 in 2005 $'s
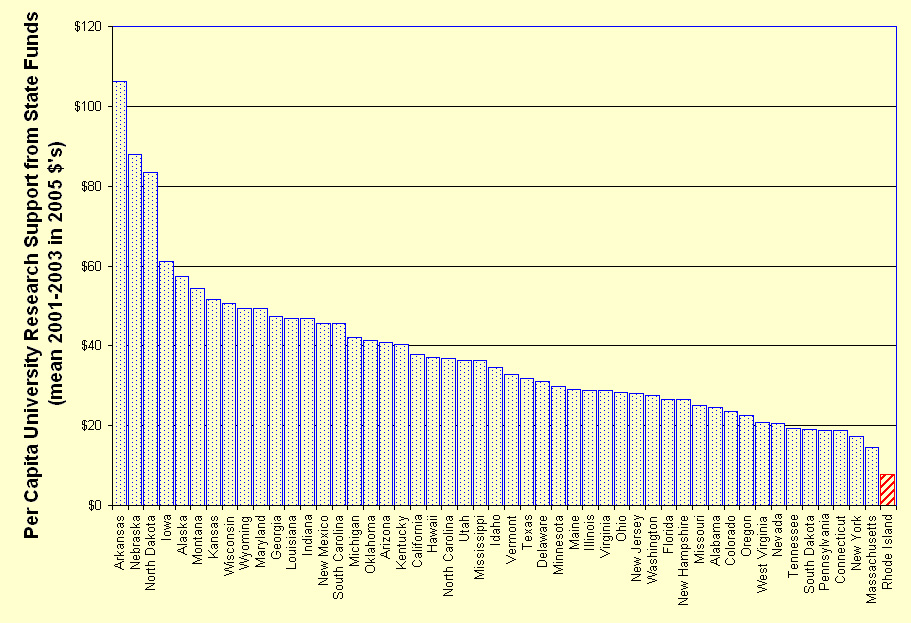
Note: Research expenditures are based on NSF's data on science and engineering. The figures shown here are weighted means of the three fiscal years 2001 through 2003, adjusted for inflation (to 2005 $'s); original expenditure data were downloaded for all institutions having research expenditures in FY2001 through FY2003 from NSF's WebCaspar. The "state" expenditures include all grants to both public and private institutions (NSF's "State and Local" expenditure source) plus "institutional" expenditures from the public institutions only. This is based on a reasoning that says that "institutional" research funds in public institutions (be they derived from tuition, state appropriations, investments, patent revenues, etc.) are the property of the state which sponsors the public institution and are hence a form of "state" funds, whereas "institutional" funds from private institutions are private property and are hence not a form of "state" funds. Although foundation funds in public institution (NSF's "other") may also be considered public (i.e., "state") property, in general they are not the result of a state allocation or a state-determined revenue stream (e.g., tuition) and hence are best regarded as "private" or "industrial" funds.
Total expenditures were converted to per capita using the 2000 census figures. The figures for each of 134 institutions (Carnegie I & II (sensu 1994), Land Grant, and URI "peers", which were used in the 2001 benchmark study) are included in the Excel data; the chart amalgamates these 134 plus all other public institutions (if any) on NSF's list for science and engineering research for at least one of the three years 2001-2003.
Source: National Science Foundation—WebCaspar (http://webcaspar.nsf.gov)
(Excel Spreadsheet and charts—0.8MB)