Research Benchmarks
2008 Update
http://www.uri.edu/artsci/com/Logan/archive/benchmarks/benchmarks08.html
(Archive | Logan | COM Department)
(Commentary)
This page contains updates to the 2001 paper, "Research Benchmarks: Funding University Research Operations and Infrastructure," which I wrote for the RI Economic Policy Council (website no longer available), plus some additions. Data sources are appended as excel spread sheets or charts; sources of information are indicated on the page, on "larger image" pages, or on the excel charts. If you have inquiries, please reach me at (mayfly@uri.edu).
Links to the original data are provided so that you may check for yourself. In general, the NSF data is downloaded from a federal database and should be accurate. Personal income and higher education authorization data are also cited; these were downloaded from the original sources. CPI, used to adjust for inflation was downloaded from the Bureau of Labor Statistics; it is listed in the first excel table. The state budget data was copied by hand from many volumes at the URI library and may contain minor transcription errors; more recent budgets and the 2009 Governor's Recommendation Budget are online (links provided).
The first three charts look at State general revenue expenditures. These are reported in the annual State Budget. At the time of this posting, the 2009 budget was an on-line proposal from the governor; it is not the final budget that will be enacted. The 2008 budget is as enacted, but the fiscal year is not complete and there were recisions and adjustments within the year. Normally, the budget is audited and expenditures corrected for the previous three years, so that an accurate tracking of actual expenditures isn't available for about 3 years. That is, in the published 2008 RI State Budget (online) we have final figures for 2006, preliminary audited expenditures for 2007, and an enacted 2008 budget which has already seen reductions in actual expenditures.
1) RI's budget grows; RI's budget for URI shrinks. |
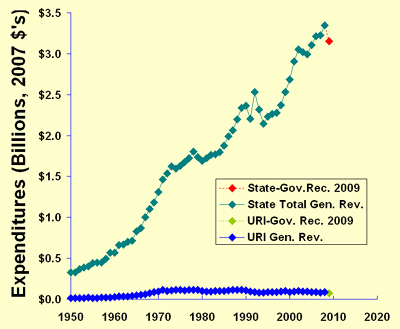
Sources:
|
"Rhode Island ranks dead last in the nation in research and development dollars expended by our public schools of higher education. We need to change that." RI State of the State Address, 2/04/2003 | |
Sources:
|
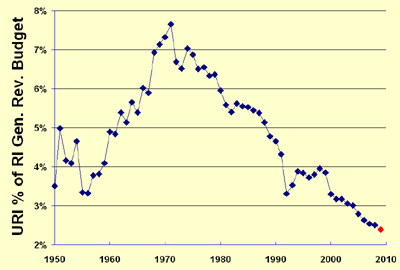
2) URI gets a declining percentage of RI's budget. |
"Contrary to elementary and secondary—where our spending is among the highest in the nation—in higher education...our investment is among the lowest (44th)." "I believe there is a direct connection between economic development and the vibrance of higher education. Private institutions have been investing and prospering, while the state has been under-investing. Although we will continute to support RIC and CCRI, URI is uniquely positioned in the biosciences, pharmacology, engineering, and marine sciences. It's time to invest in these sciences for the jobs of the 21st century." —RI State of the State Address, 2/04/2004 | |
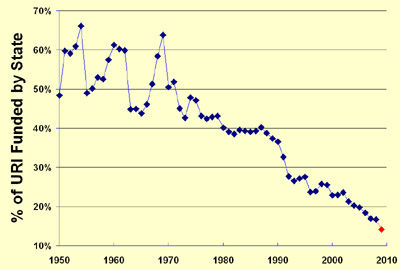
3) RI funds a declining percentage of URI's budget. |
Sources:
|
Source:
|
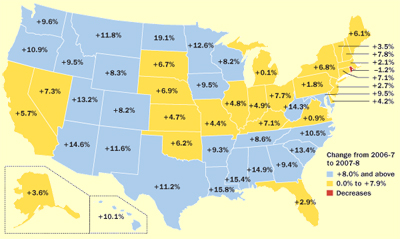
4) In 2008, RI was unique in cutting higher education. |
5) National support for university research has increased steadily for over 35 years. A long and steady growth in U.S. university research (note constant dollars, 2007 used here) has recently shown signs of a plateau (with federal funds, a casualty of the Republican war on science, flattening at 68.2% of total in 2006). State (i.e., agencies like RI's DEM or DOT) and institutional (i.e., from general revenue or tuition) funds (combined, 21.8% in 2006) are important to maintain continuity and vitality of American scientific and techological innovation. |
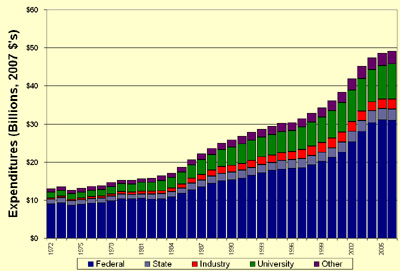
Source: National Science Foundation—WebCaspar (webcaspar.nsf.gov) |
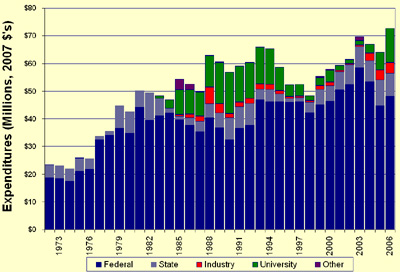
Source: National Science Foundation—WebCaspar (webcaspar.nsf.gov) |
6) URI works to support research. From 1990 to 2003, URI's institutional spending on research dropped by 87%; more recently, URI has provided more. Federal funds (85.2% of URI research support in 2002) now cover 66.3% of URI's research expenditures. URI's state and institutional funds (14.1% in 2002) doubled between 2002 and 2006. Do steady cuts in institutional support (above), and increased pressure for fewer faculty to teach more students mean future cuts in institutional funds for URI research? |
7) Brown is growing its research program. Brown, RI's other research university, and URI had nearly equal research expenditures in the mid 1980s. Brown's growth was accomplished with a generous infusion of institutional research funds. |
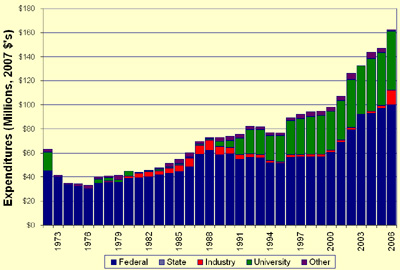
Source: National Science Foundation—WebCaspar (webcaspar.nsf.gov) |
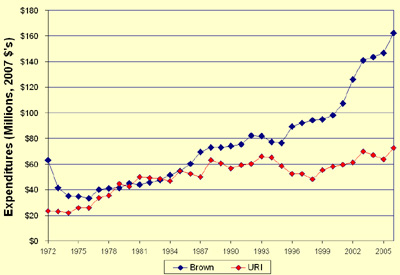
Source: National Science Foundation—WebCaspar (webcaspar.nsf.gov) |
8) Growth in private university research is outpacing public university research in RI. In the 1980s, Brown and URI spent similar amounts on research. In 2006, Brown's research expenditures were 2.23 times URI's. Does Brown's growing research presence and URI's failure to keep up suggest a state policy of privatizing academic research? Note that the research foci and portfolios of these two universities are quite different; each addresses society's needs uniquely. |
9) Should URI be a "top 100" research university? The "top 100" research universities are ranked on NSF's science and engineering expenditure data. URI and Brown were both "top 100's" in the early 1980s; In 1985, Brown ranked 99 and URI 100. In 2006, Brown ranked 100 and URI 145. To have tied Brown's 100th ranking in 2006, URI would have needed over $87 million in research expenditures (2.22 times URI's actual expenditures). (See ProJo from June 10, 2006) |
Source: National Science Foundation—WebCaspar (webcaspar.nsf.gov) |
Source: National Science Foundation—WebCaspar (webcaspar.nsf.gov) |
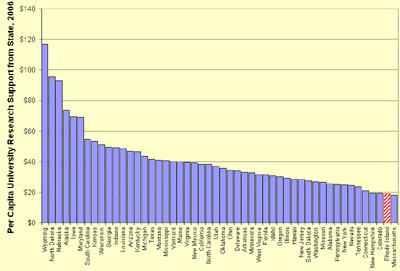
10) RI was 49th in State Support for University Research in 2006. The mean $'s per capita of state funds (state agency funds to both public and private institutions for contracted research plus state university (i.e. "public") institutional funds) for 2006 was $19.15 in Rhode Island, 47% of the national average of $40.88, placing Rhode Island next to last in the nation. With recent cuts in state support to URI, RI can not avoid returning to last place. |
11) Rhode Island is 45th in supporting Higher Education Operations. Rhode Island's per capita 2008 state allocation for higher education operations was $172, 59% of the national average (down from 79% and 44th ranked in 2006). |
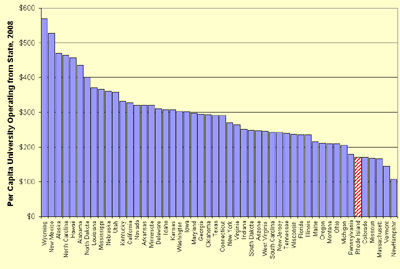
Source: Illinois State University College of Education Center for Higher Education and Educational Finance (Grapevine) (http://www.coe.ilstu.edu/grapevine) |
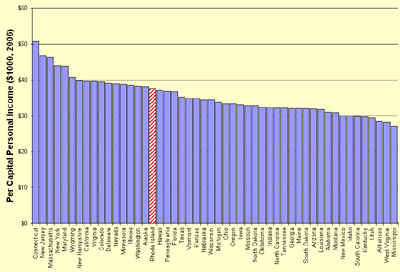
Source: U.S. Department of Commerce, Bureau of Economic Analysis (News Release, March 26, 2008) |
12) RI Personal Income is above the U.S. average. Rhode Island mean personal income in 2006 was $37,523 (102% of U.S. average), ranking RI 17th. In part, this is related to high incomes in Connecticut ($50,762 — #1) and Massachusetts ($46,299 — #3); approximately 1 in 7 residents of Rhode Island work in these two states. |
13) RI's Research % of Higher Ed is below average. Research expenditures (2006, figure 10) can not be strictly compared to higher education operational expenses (2008, figure 11), but their ratio does provide a reasonable approximation of the relative importance of research within the higher education budget of each state. RI's ratio of 2006 research operations as a percentage of 2008 higher education operations, ~11%, is 77% of the national average, up considerably (33rd) from RI's last place 3 years ago: will this continue under projected URI budget cuts? |
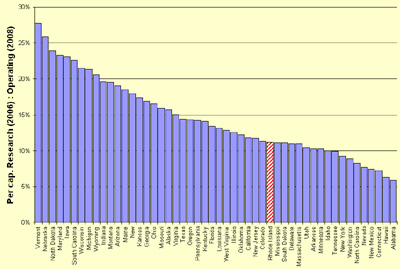
Source: See figures 10 and 11 |
Source: See figures 10 and 12. |
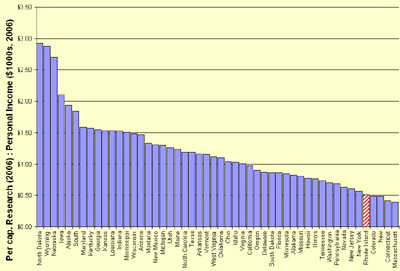
14) We Spend Little Personal Income on Research. Although relatively well off individually, collectively we spend little of our 17th place per capital personal income on university research. Our ratio of $.51 spent on university research per $1000 of personal income was 43% of the national average ($1.19), earning RI a 46th place ranking for 2006; again, is even this poor showing sustainable given projected cuts to URI? |